Capturing opportunities in today’s credit markets
Executive Summary
At Ares, we focus on constructing investment solutions within what we refer to as the “sweet spot” of credit, or rather, certain segments of the global fixed income markets that offer higher income and diversification relative to traditional asset classes. We believe well-diversified portfolios spanning asset classes within scope of this “sweet spot”, provide Australian investors with attractive relative yields with downside protection and shorter duration.
In this thought piece, we illustrate one of the keys to success for navigating the “sweet spot,” opportunity set: a dynamic, flexible approach to capture relative value opportunities.
Shorter and More Frequent Dislocations
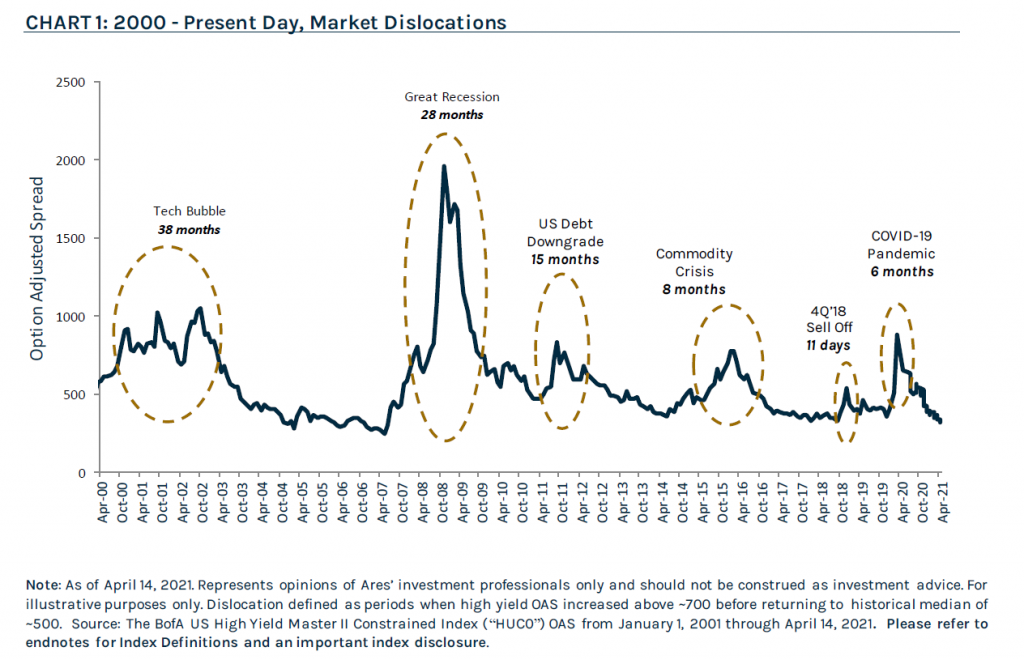
Structural shifts in capital markets since the “Global Financial Crisis” or “Great Recession” have caused market dislocations to become shorter and more frequent. As a result, investors are choosing to outsource allocation decisions to managers with strong market presence that are better positioned to manage risk and capitalise on investment opportunities as market conditions evolve.
Chart 1 illustrates market dislocations that have taken place during the 2000s, as defined by periods when the credit spreads here represented by option adjusted spread (“OAS”) for the broader high yield market (measured by the ICE BofA US High Yield Master II Index) increased above 700 before returning to the historical median of 500. The Great Recession, along with prior dislocations, lasted two or more years. Conversely, spreads retraced within six months of the March 2020 dislocation. As market dislocations become shorter and more frequent, a dynamic and flexible approach has become critical to capturing attractive relative value opportunities that arise in episodic periods of volatility.
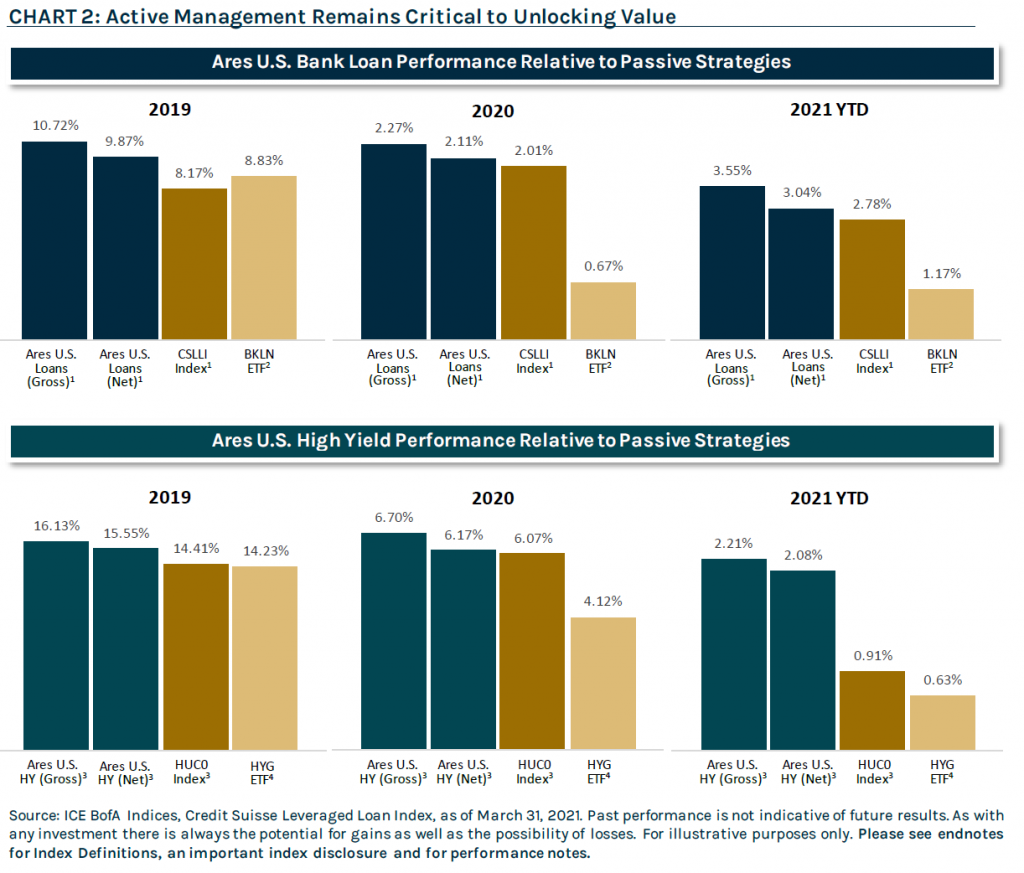
It is also worth highlighting that in non-traditional credit asset classes, active management is paramount to capture above benchmark returns. Unlike in equities or traditional fixed income, passive strategies in bank loans or high yield are often unable to adequately replicate benchmark returns due to model limitations. Over the course of 2019, 2020 and 1Q’21, the market presented very different investment environments. As illustrated below, during each of these periods, Ares was able to consistently outperform both broad market indices and larger ETFs in the loan and high yield sectors, underscoring the importance of a dynamic approach across asset classes but also active management within each of those sectors.
2020: A Banner Year for Relative Value Investing
2020 was a complex, tumultuous year for global financial markets. We believe there was no single “trade”, as managers had several opportunities to generate alpha through active asset rotation and disciplined credit selection. Even as markets recovered from the March lows, the rate at which spreads retraced varied significantly across asset classes, rating cohorts, and geographies as market conditions evolved, presenting ample opportunity for managers looking to take advantage of inefficiently priced segments of the market.
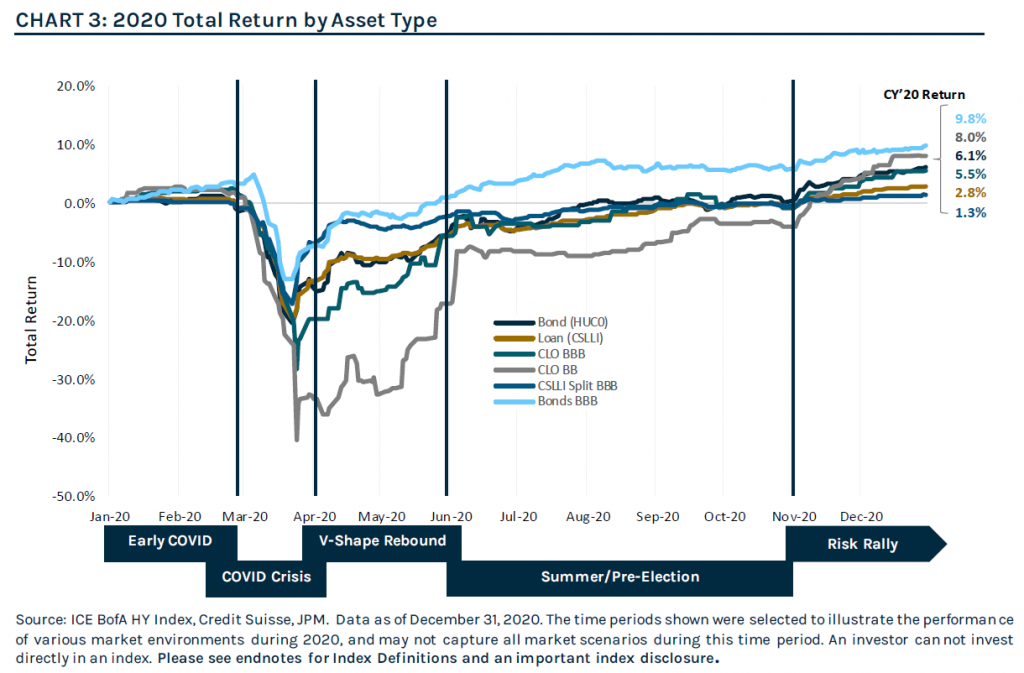
By actively repositioning our multi-asset credit portfolios as market conditions evolved throughout the year, we were able to capitalize on air pockets of volatility and capture relative value opportunities. Below is a summary of notable market themes during each of the periods illustrated above, and how we positioned our portfolios accordingly.
- Early Covid: After a strong start to the year, credit markets came under pressure in early March, as COVID-19 began to spread outside of China to the United States and Europe. As a result of elevated volatility, the Federal Reserve (“the Fed”) pre-emptively cut interest rates to near zero. In February, we raised cash across portfolios as COVID-19 became more serious to be well-positioned to buy any oversold investment opportunities.
- Covid Crisis: The global pandemic drove an economic standstill and as a result, global financial markets experienced a severe downdraft in late March. Amid heighted volatility, we rotated up in quality into high grade corporate debt, which sold off alongside sub-investment grade credit amid indiscriminate selling.
- V-Shape Rebound: Risk assets rallied as asset prices were buoyed by unprecedented stimulus from the global central banks. We took profits on our high-grade corporate debt exposure and rotated into investment-grade CLO debt securities given the long-run total return potential for the asset class and a yield premium to similarly rated corporate debt. While structured credit lagged the recovery seen in high yield bonds and bank loans, the asset class continued to make substantial gains since March lows amid improving technicals.
- Summer / Pre-election: Credit markets remained resilient and spreads continued to tighten while default expectations improved, as accommodative fiscal and monetary support overshadowed rising COVID-19 infection rates and elevated U.S. Presidential election uncertainty. We remained overweight corporate bonds and underweight loans, as bond technicals remained supportive amid strong primary issuance, fund flows and the Fed’s backstop.
- Risk Rally: The significant rebound from March lows continued as election and vaccine related optimism lifted investor sentiment, despite the resurgence of COVID-19 cases and social unrest. Most credit sectors traded at or inside pre-pandemic levels by year-end. Within our below investment-grade corporate debt exposure, we rotated into bank loans, as the asset class screened more attractive on a relative value basis than bonds, given their short duration, convexity profile and senior secured spread. In addition to the attractive yield, loans offer protection against both potential rising interest rates and a potential stalled recovery given the security of the asset class.
Our agile approach in 2020 underscores the importance of a dynamic and flexible approach in shifting market environments. Informed by quantitative analysis and fundamental research, our demonstrated ability to express relative value across the credit markets drove strong performance for our multi-asset portfolios in 2020.
Conclusion
The “sweet spot of credit” encompasses a $5.0 trillion opportunity set across the U.S. and European leveraged loan, high yield, and alternative credit markets. To be a successful investor in these markets, we believe one of the keys to success is to employ a dynamic approach with the flexibility to select the most attractive relative value opportunities. At Ares, we believe our differentiated approach to identifying and unlocking value is rooted in the scale and integration of our Global Liquid and Alternative Credit strategies which allows us to fully leverage extensive research capabilities, proprietary technologies and longstanding relationships.
Components of the Ares Edge
- 75+ investment professionals (c. 20 years of experience) in Liquid and Alternative Credit with track records of 10+ years have worked together across market cycles
- Portfolio construction and analysis is informed by proprietary technologies and risk management tools, providing Ares a sourcing and execution edge and offers transparency for investors
- An integrated platform to capitalize on growing bank disintermediation, allowing for favorable allocations and preferred economics
Owing to these competitive advantages, we believe Ares’ multi-asset credit strategies offer a compelling opportunity for Australian investors seeking diversification [1], stable current income and attractive risk-adjusted returns in varied market environments.
[1] Note: Diversification does not assure profit or protect against market loss.
This article contains the opinions of Ares Liquid Credit Team and is neither an offer to sell, nor the solicitation of an offer to purchase, any security, the offer and/or sale of which can only be made by definitive offering docs. The opinions expressed herein are subject to change without notice. Information contained herein has been obtained from sources believed to be reliable but is not guaranteed. All charts, graphs and tables are shown for illustrative purposes only. This article is distributed for educational purposes and should not be considered investment advice or an offer of any security for sale. Past performance is not indicative of future results and no representation is made that stated results will be replicated.
Index Definitions
Credit Suisse Leveraged Loan Index (“U.S. Bank Loans”) is designed to mirror the investable universe of the $US-denominated leveraged loan market. The index inception is January 1992. The index frequency is daily, weekly and monthly. New loans are added to the index on their effective date if they qualify according to the following criteria: 1) Loan facilities must be rated “5B” or lower. That is, the highest Moody’s/S&P ratings are Baa1/BB+ or Ba1/BBB+. If unrated, the initial spread level must be Libor plus 125 basis points or higher. 2) Only fully-funded term loan facilities are included. 3) The tenor must be at least one year. 4) Issuers must be domiciled in developed countries; issuers from developing countries are excluded.
Credit Suisse Leveraged Loan Index Split BBB is a subset of the CSLLI and includes only split BBB issuers. It uses a single “blended” Moody’s/S&P rating to compute averages sorted by rating. Excludes split B because the split B loan index is heavily represented by one single corporate issuer.
JP Morgan U.S. CLO BBB Index tracks floating-rate CLO securities in 2004-present vintages, rated BBB. Additional sub-indices are divided by ratings AAA through BB, and further divided between pre- and post-crisis vintages. CLO 2.0, or post-crisis vintages, include deals issued in 2010 and later. CLOIE utilizes a market-value weighted methodology. Inception date: July 15, 2014.
JP Morgan U.S. CLO BB Index tracks floating-rate CLO securities in 2004-present vintages, rated BB. Additional sub-indices are divided by ratings AAA through BB, and further divided between pre- and post-crisis vintages. CLO 2.0, or post-crisis vintages, include deals issued in 2010 and later. CLOIE utilizes a market-value weighted methodology. Inception date: July 15, 2014.
The BofA US High Yield Master II Constrained Index (“HUC0”) tracks the performance of US Dollar denominated below investment grade corporate debt publicly issued in the US domestic market with a maximum issuer exposure of 2%. The returns of the benchmark are provided to represent the investment environment existing during the time period shown. For comparison purposes the index includes the reinvestment of income and other earnings but does not include any transaction costs, management fees or other costs.
The ICE BofA BBB US Corporate Index “C0A4”, a subset of the ICE BofA US Corporate Master Index tracking the performance of US dollar denominated investment grade rated corporate debt publicly issued in the US domestic market. This subset includes all securities with a given investment grade rating BBB. When the last calendar day of the month takes place on the weekend, weekend observations will occur as a result of month ending accrued interest adjustments.
Note: This may contain information sourced from Bank of America, used with permission. Bank of America’s Global Research division’s fixed income index platform is licensing the ICE BofA Indices and related data “as is,” makes no warranties regarding same, does not guarantee the suitability, quality, accuracy, timeliness, and/or completeness of the ICE BofA Indices or any data included in, related to, or derived therefrom, assumes no liability in connection with their use and does not sponsor, endorse, or recommend Ares Management, or any of its products or services.
Performance Notes
Active Management Remains Critical to Unlocking Value
1. As of March 31, 2021. Total returns include the reinvestment of dividends and other earnings from securities or other investments held by the portfolio. Returns are unaudited and as with all unaudited estimates, they are subject to uncertainties and variations and may not be predictive of final results. Past performance is not indicative of future results. The performance inception date is December 12, 2008. Gross returns do not reflect the deduction of management fees or other expenses. Net returns are calculated by subtracting the applicable management fee and other expenses from the gross returns on a monthly basis. The fee schedule used in the net return calculation is as follows: 0.50%per annum. Returns are expressed in US Dollars. The Ares Institutional Loan Fund ramped close to half a billion dollars from December 2008 through August 2009, the resultant cash drag of which contributed to an underperformance of 1,000 basis points versus the CSLLI. Since being fully ramped, Ares ILF has outperformed the CSLLI by approximately 1,890 basis points on a gross cumulative basis as of March 31, 2021. Index provided for comparison purposes only. The benchmark for Ares Institutional Loan Fund is the CSLLI. Benchmark returns are provided to represent the investment environment existing during the time period shown. The returns for the Credit Suisse Leveraged Loan Index include the reinvestment of income and other earnings, but do not include transaction costs, management fees or other costs.
2. Invesco Senior Loan ETF (“BKLN”) invests in the fixed income markets of the United States. It primarily invests in high yield U.S. dollar denominated senior loans including leveraged loans, bank loans, and/or floating rate loans issued by banks and other lending institutions with minimum initial term of 1 year. The fund seeks to replicate the performance of the S&P/LSTA U.S. Leveraged Loan 100 Index, by using representative sampling technique.
3. As of March 31, 2021. Performance for High Yield Bonds is represented by the U.S. High Yield Composite, which includes all actual, fully discretionary, fee-paying, separately managed portfolios that primarily invest in U.S. high yield fixed income securities and are benchmarked to the ICE BofA US High Yield Master II Constrained Index (“the HUC0”). Benchmark returns are provided to represent the investment environment existing during the time period shown. The returns for the ICE BofA US High Yield Master II Constrained include the reinvestment of income and other earnings, but do not include transaction costs, management fees or other costs. Portfolios in the U.S. High Yield Composite have an emphasis on capital appreciation and income. The benchmark for the U.S. High Yield Composite is the ICE BofA US High Yield Master II Constrained Index, which tracks the performance of U.S. Dollar-denominated below investment grade corporate debt publicly issued in the U.S. domestic market with a maximum issuer exposure of 2%. The inception date of the U.S. High Yield Composite is May 2007. Investment track record of 15+ years dates prior to composite inception when Ares managed syndicated loans and high yield assets as part of its CLO strategy. Actual fees of the portfolios in each composite may vary depending on, among other things, the applicable fee schedule and portfolio size. Composites may contain accounts with performance based fees. Investment management fees are described in Part 2 of the adviser’s Form ADV. All returns are expressed in U.S. Dollars. Performance is preliminary and subject to change.
4. The iShares iBoxx $ High Yield Corporate Bond ETF (“HYG”) seeks to track the investment results of an index composed of U.S. dollar-denominated, high yield corporate bonds.
REF: AAM-00125
Disclaimer – Fidante Partners
Fidante Partners Limited ABN 94 002 835 592 AFSL 234668 (Fidante) has entered into arrangements with Ares and Ares Australia Management Pty Ltd ABN 51 636 490 732 (AAM), in connection with the distribution and administration of financial products managed by Ares or AAM. In connection with those arrangements, Fidante or AAM may receive remuneration or other benefits in respect of financial services provided by the parties. Neither Fidante nor AAM are responsible for the information in this material, including any statements of opinion. AAM is an Authorised Representative No. 001280423 of Fidante and is in the process of seeking its own Australian financial services licence.
Ares is exempt from the requirement to hold an Australian Financial Services Licence. Ares is subject to regulation by the Securities & Exchange Commission of the United States of America under US laws, which differ from Australian laws. None of Ares Australia Management Pty Limited, Fidante Partners Limited, nor any of their associates, has prepared the information in this publication and accept no liability whatsoever in relation to it. This publication is only made available to ‘wholesale clients’ or ‘sophisticated investors’ under the Corporations Act 2001 (Cth) in Australia.