Compelling Opportunity for Investors: Improving Convexity, Yet Benign Default Risk
What is Convexity & Why Is It Important?
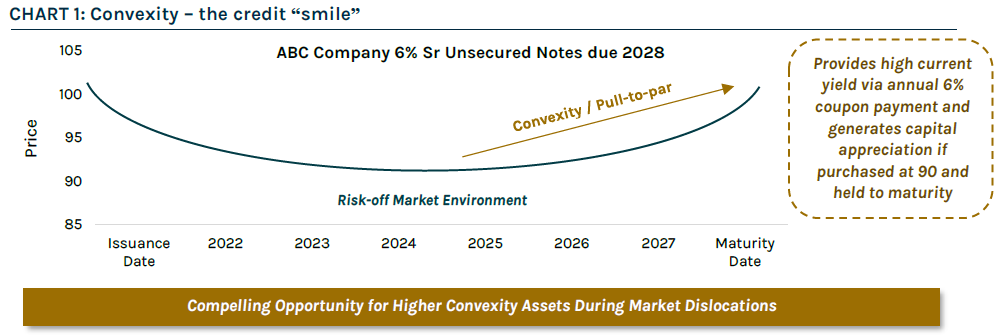
When credit instruments sell off, market participants will often talk about convexity being back. So, what is it?
Convexity can involve complex mathematics; however, a simple way to describe the concept is that it occurs where risk and reward are asymmetrical: positive convexity refers to an investment with more upside than downside; while negative convexity means the downside is greater than the upside.
During a risk-off environment, the price of a credit instrument typically drops below its nominal value (also referred to as “face” or “par” value) due to perceived increased default risk. As illustrated by the example in Chart 1 below, there is a compelling investment opportunity when a bond trades at a discount to its nominal value – assuming the bond does not default, a bond’s price will benefit from a natural “pull” to the nominal value as it approaches maturity. This movement is referred to as “pull-to-par”. Typically, bonds and loans that trade at a discount have positive convexity, offering investors enhanced yield and capital appreciation potential without taking excess risk.
Market Opportunity – Convexity & Higher Yields
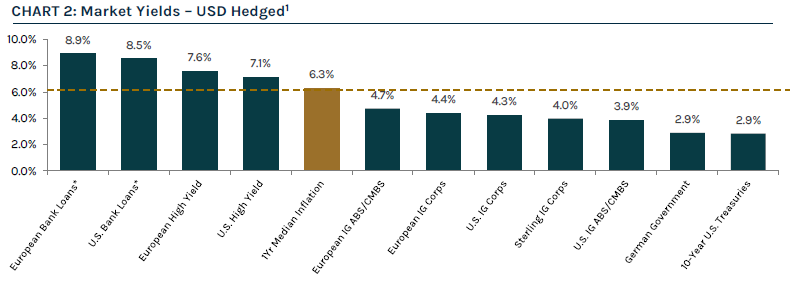
Calendar year 2022 has presented significant turmoil for global financial markets amid a risk-off environment and sustained macro uncertainty. Global inflationary pressures continue to persist, including the ongoing war in Ukraine, slowing growth, higher energy prices and supply-chain disruptions. Central banks face substantial challenges as they look to combat elevated inflation with interest rate hikes, but without triggering a recession. Against the backdrop of wider spreads and the sell-off in rates over the past few months, fixed income yields have reset to higher levels, presenting an attractive opportunity for yield-focused investors. Global leveraged credit assets are providing a meaningful pickup in real yields when compared to traditional fixed income markets, as illustrated in Chart 2.
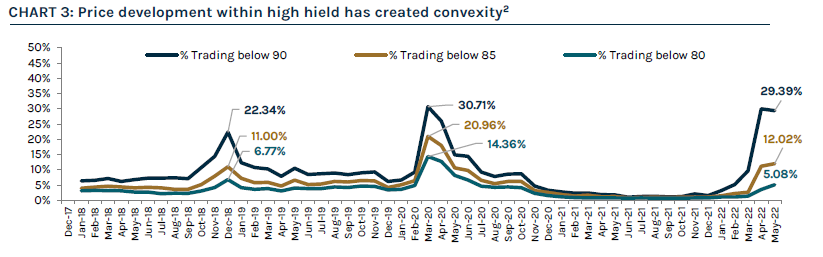
Higher yields and a decline in asset prices have introduced greater upside convexity in leveraged credit
markets for total return investors, particularly for high yield bonds. As illustrated in Chart 3, the proportion of the U.S. high yield market currently trading below par has climbed towards levels not seen since March 2020. Further, headline high yield prices have only been lower than their current levels for approximately 5% of the time over the past 10 years. With convexity in high yield bonds’ favour, there’s greater upside potential than downside risk as borrowing costs continue to rise.
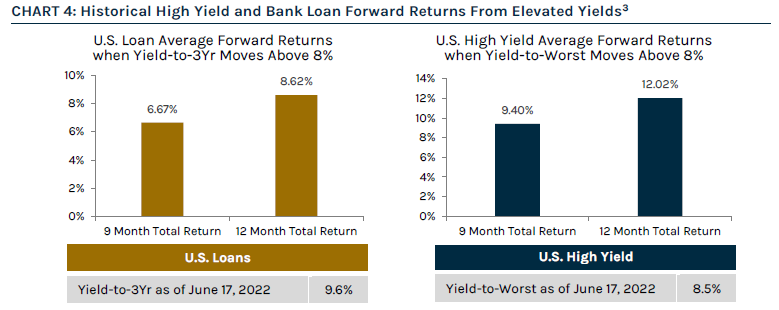
This combination of higher yields and cheaper prices in an environment where bouts of volatility have become shorter and more frequent, is presenting alpha generating opportunities for active managers. History suggests investing in periods of dislocation, when yields reach current levels, provides attractive forward returns in the high yield bond and bank loan markets.
Market Outlook
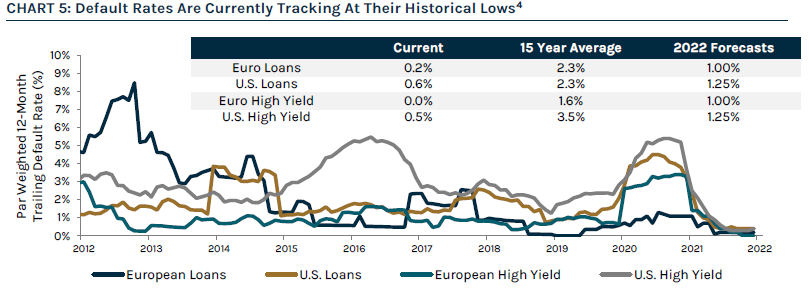
Despite elevated volatility within financial markets this year, default rates remain below 1% and are tracking near historical lows. We do expect default rates to modestly increase moving forward given tighter monetary conditions and slowing growth. That said, even if we hit a recession in the next 12-24 months, we don’t expect default rates to come close to the highs experienced in previous dislocations and anticipate they’ll remain below historical averages. Expectations for a benign default outlook are supported by (1) healthy corporate balance sheets, (2) maturity walls that have been pushed out over the past year, and (3) leverage levels that are below historical averages.
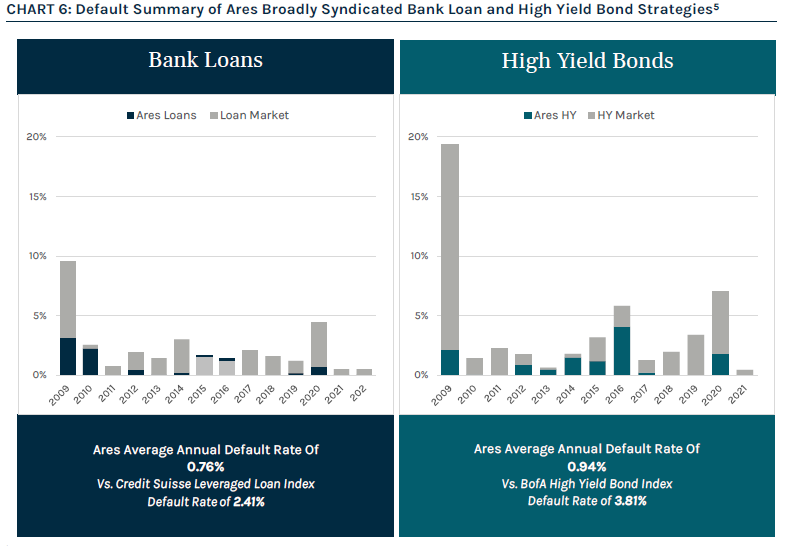
Looking forward, we expect volatility to persist with the potential for asset coverage leakage and an uneven recovery across markets. We believe credit spreads are currently at levels that represent attractive entry points, but tail risks have increased, and we anticipate elevated credit dispersion as well as rising idiosyncratic credit events driven by a host of conflicting themes. We believe Ares is well positioned to provide superior credit selection and vigilant risk management in today’s volatile market due to our disciplined investment process that focuses on capital preservation, predicated on bottom-up fundamental research with the goal of minimizing default risk by identifying and avoiding marginal quality credit. This core tenet of Ares’ investment philosophy has resulted in significantly lower defaults in its bank loan and high yield bond strategies, particularly in periods of dislocation.
In summary, as investors are faced with rising rates and elevated inflation, many may struggle to determine how best to position their credit exposure in an effort to maximize yield and mitigate risk. At Ares, our differentiated approach to capitalizing on the best risk-adjusted return opportunities across the investable universe is rooted in the scale and integration of our Global Liquid and Alternative Credit strategies, which allows us to fully leverage extensive research and origination capabilities, proprietary technologies and longstanding relationships.
Teiki Benveniste is Head of Ares Australia Management.
To access the full version, download the PDF
1 Data as of May 31, 2022. For illustrative purposes only. Asset class yields do not represent a return to investors. Forecasts are inherently limited and should not be relied upon as indicators of actual or future performance. *Represents the yield to three-year call. Sources: ICE BofA Indices, S&P Capital IQ, Credit Suisse, Bloomberg. European Bank Loans represented by the Credit Suisse Western European Leveraged Loan Index (“CSWELLI”). U.S. Bank Loans represented by the Credit Suisse Leveraged Loan Index (“CSLLI”). U.S. High Yield represented by the ICE BofA US High Yield Index (H0A0). European High Yield represented by the ICE BofA Euro High Yield Index (HE00). U.S. IG Corps represented by the ICE BofA US Corporate Index (C0A0). Sterling IG Corps represented by the ICE BofA Sterling Corporate Index (UR00). European IG ABS/CMBS represented by the ICE BofA Euro Asset backed & Mortgage-backed Securities Index (EA00). 10-Year U.S. Treasuries represented by the ICE BofA 7-10 Year US Treasury and Agency Index (G4A0). U.S. IG ABS/CMBS represented by the ICE BofA US ABS & CMBS Index (CABS). European IG Corps represented by the ICE BofA Euro Corporate Index (ER00). German Government Bonds represented by the ICE BofA German Government Index (G0D0). Note: Yield to worst data is being presented unless otherwise noted. All yields are USD-hedged. Inflation expectation figured provided in the April 2022 Survey of Consumer Expectations, Federal Reserve Bank of New York. Please see endnotes for Index Definitions.
2 For illustrative purposes only. All data is as of May 31, 2022. Sources: U.S. High Yield represented by the ICE BofA US High Yield Constrained Index (HUC0). Please see endnotes for index definitions.
3 Note: For illustrative purposes only. Forecasts are inherently limited and should not be relied upon as indicators of actual or future outcomes. The period of analysis is from January 1997 to May 2020. Source: Credit Suisse, ICE BofA Indices, Bloomberg. The chart shows the forward returns of asset classes when respective yields exceed 8% as defined by yield-to-worst for high yield bonds and yield to 3-year life for bank loans.
4 For illustrative purposes only. Current and 15 year average default rates are as of May 31, 2022. Source: European Loans represented by the Credit Suisse Western European Leveraged Loan Index (“CSWELLI”). U.S. Loans represented by the Credit Suisse Leveraged Loan Index (“CSLLI”). European High Yield represented by the Credit Suisse Western European High Yield Index. U.S High Yield represented by the Credit Suisse High Yield Index. Distressed exchanges included in default rate calculation. 2022 forecasts are sourced from JP Morgan. Please see endnotes for index definitions.
5 LTM annual average par-weighted default rates for the period January 1, 2009 – March 31, 2022. U.S. bank loan default rates represented by the CSLLI. Ares bank loan default rates are represented by all bank loan transactions in all commingled funds and separately managed accounts executed by investment professionals within Ares Liquid Credit Group. U.S. high yield default rates are represented by the H0A0. Ares high yield default rates are represented by all high yield bond transactions in all commingled funds and separately managed accounts executed by investment professionals within Ares Liquid Credit Group.
This article contains the opinions of Ares Liquid Credit Team and is neither an offer to sell, nor the solicitation of an offer to purchase, any security, the offer and/or sale of which can only be made by definitive offering docs. The opinions expressed herein are subject to change without notice. Information contained herein has been obtained from sources believed to be reliable but is not guaranteed. All charts, graphs and tables are shown for illustrative purposes only. This article is distributed for educational purposes and should not be considered investment advice or an offer of any security for sale. References to “downside protection” or similar language are not guarantees against loss of investment capital or value. Diversification does not assure profit or protect against market loss. Past performance is not indicative of future results and no representation is made that stated results will be replicated.
Please see PDF above for Index Disclosure & Definitions


