Seeking Clarity in Private Debt
Executive Summary
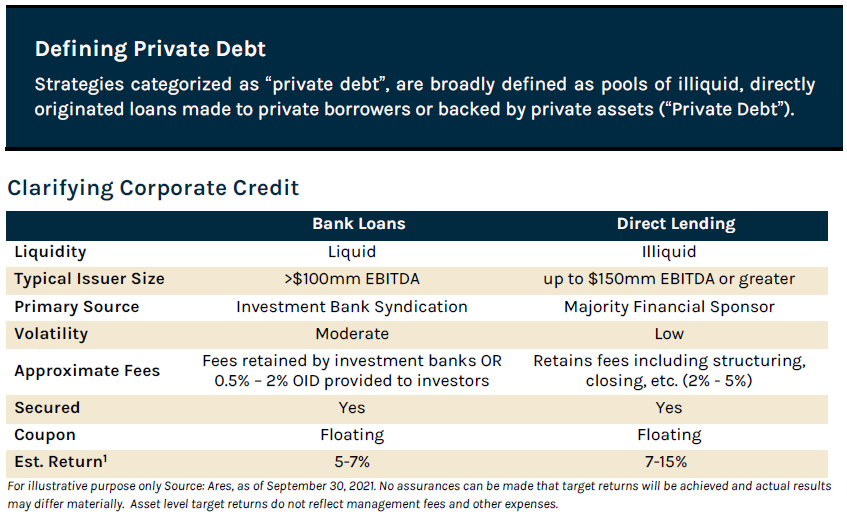
The well-publicized secular shift from public to private capital continues to garner interest from companies and allocators, contributing to increased adoption and continued growth in supply and demand. The private debt market has exhibited growth as banks continue to retreat from middle market lending and allocators seek sources of stable income amidst an extended period of compressed rates. Within corporate credit, this has predominantly unfolded through the growth of directly originated loans, otherwise known as Direct Lending.
The Direct Lending asset class shares certain characteristics with broadly syndicated loans, commonly referred to as Bank Loans. We’ve noticed this has created some confusion amongst Australian investors, often viewing Direct Lending and Bank Loans as a singular asset class. While they have certain similarities, Direct Lending and Bank Loans exhibit key differences which can have a material impact on an investor’s portfolio if not identified.
In this short piece, we seek to distinguish between directly originated loans (“Direct Lending”) and broadly syndicated loans (“Bank Loans”), address their similarities and potential synergies which can be exploited by managers with scale and experience to generate attractive, income-producing portfolios across market environments.
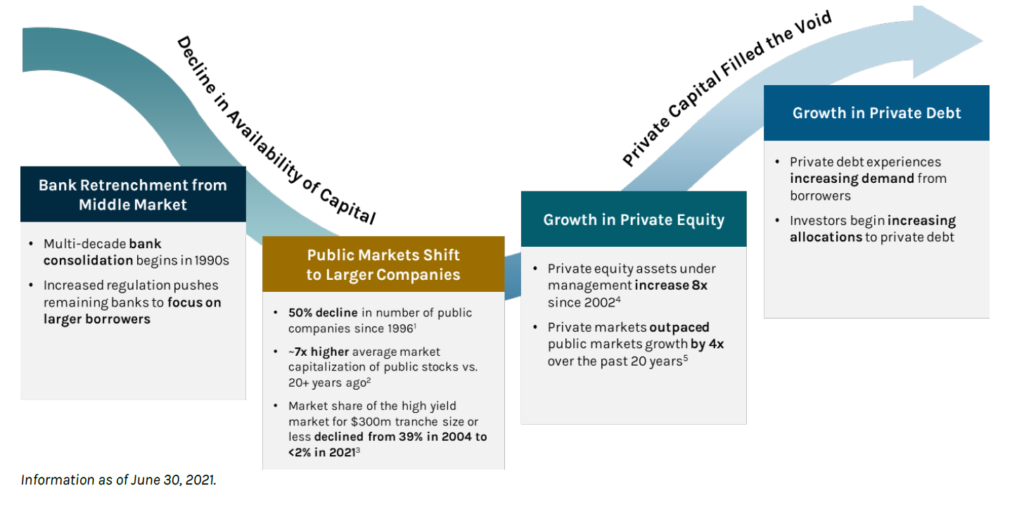
The growth in Direct Lending is the result of structural changes causing a multi‐decade shift from traditional providers of capital, such as banks, to the private markets. This shift resulted in managers like Ares filling the void to finance the growth of small and medium‐sized companies. While banks continue to provide financing to larger companies, these transactions are often syndicated to investors, typically managers, who hold the asset on their respective balance sheets.
Shift from Public to Private Capital
For allocators, the benefit of Direct Lending is often high income with substantial illiquidity and complexity premiums, reduced volatility and attractive downside protection characteristics which are driven by their relatively lender friendly structures. We believe these traits are optimized by managers with the infrastructure and scale to consistently originate deals and provide flexible capital across cycles.
As mentioned above, banks continue to provide financing to larger companies, though risk is syndicated away from their balance sheet. While these assets bear some similarities with Direct Lending, we believe these are distinct asset classes.
Control vs. Participation Direct Lending
Within Direct Lending, an important distinction needs to be made between Control Direct Lending and Participation Direct Lending.
With Control Direct Lending, the investment manager who sources and originates the loan generally allocates all or a controlling share of the loan to one or more funds and accounts it manages. The investment manager generally has control over the loan documentation and access to the full origination fees. Importantly, Ares believes these fees, ranging from 2% to 5% upfront, should be passed on to the funds or accounts invested in the loan to avoid conflicts of intertest and creating the wrong incentives.
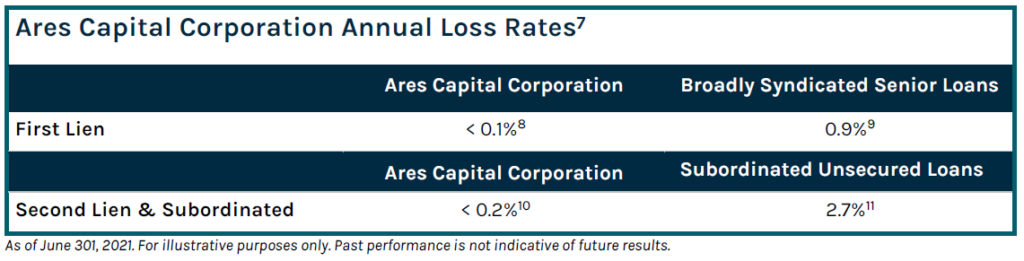
Moreover, it requires a robust infrastructure to structure transactions, lead the negotiation of transaction documentation and closely monitor each investment post-closing. Employing a robust portfolio monitoring strategy through regular dialogue and reporting with management teams and controlling stakeholders facilitates transparent communication with borrowers. It also provides early warnings for potential issues or opportunities within the portfolio for value creation or protection and maximizes investment outcomes. A key benefit resulting from Ares’ Direct Lending approach and capabilities has been below average loss rates through numerous market cycles.
Conversely, Participation Direct Lending is when a manager holds a minority investment in a loan originated by a Control Direct Lender or group of other lenders. This type of lending comes with limited control over loan documentation, terms and conditions and covenants, as well as lower economics as Control Direct Lenders retain most of the origination fees. It also means the Control Direct Lender is the one directly interacting with the borrower while the Participant Direct Lender has limited opportunities to build a relationship with the management of the company. It is therefore much more difficult for a Participation Direct Lender to become “the bank” of the company and benefit from incumbency.
Understanding the percentage of loans held in a portfolio which are self-originated by the manager, in addition to the level of control, is key to understanding the level of downside protection and preferred economics likely to be generated.
Direct Lending and Bank Loans: Key Distinctions
Direct Lending or “Corporate Direct Lending” loans and Bank Loan assets do not qualify as securities, unlike bonds. While this can lead to allocators grouping them as a singular asset class, they have significant distinguishing qualities.
In most cases Bank Loans and Corporate Direct Lending loans are made to private companies. While the end borrower in both instances is private, we consider Bank Loans to be akin to publicly traded instruments such as bonds. Conversely, we consider Corporate Direct Lending loans to be Private Debt instruments. Two key differences that explain this are their respective liquidity profiles and how they are originated.
Ares has managed Bank Loan strategies since 1997 and classifies them as liquid credit akin to public instruments like bonds. Due to their broadly syndicated nature, multiple investors are typically involved in a single transaction. Those managers allocate the asset across a variety of fund structures, creating an active secondary market which makes them liquid and easy to mark-to-market. Primarily accessed by institutional investors, Bank Loans can be held in daily liquid funds, broadening the investor base. While liquidity introduces mark-to-market volatility, active managers can use these “air pockets” of volatility to acquire discounted assets and enhance total returns.
From an origination perspective, Bank Loans are sourced and structured by banks, not self-originated by alternative investment managers. That said, managers with scale, experience and relationships with private equity sponsors can get a seat at the origination table alongside banks as an arranger. In these scenarios, a manager can obtain preferred allocations and additional economics.
Specific to Corporate Direct Lending, Ares has been a leader in this asset class since 2004. These directly originated corporate loans are illiquid, and exits are typically due to a change of control or refinancing; if neither exit occurs, the asset will be held to maturity. As a result, Corporate Direct Lending loans are not traded. One complication for some investors is that Corporate Direct Lending loans require dedicated resources and in-depth market knowledge to appropriately mark-to-market these loans. This type of valuation process involves independent third parties and consideration for both enterprise value and the prevailing yield environment to reflect a fair valuation of the loans.
The direct sourcing and illiquidity of these loans can lead to multiple potential benefits for investors. Without an investment bank sourcing the transactions, managers serve as the agent in Direct Lending and retain upfront fees of 2-5%, which vary based on the number of participants and their role in the transaction. Importantly, we believe these fees should be passed on to the funds or accounts invested in the loan to avoid conflicts of intertest and create the wrong incentives. Due to the lack of an active secondary market, borrowers are less likely to lock in a lower cost of capital, leading to the illiquidity premium associated with the Direct Lending asset class. This premium is sustainable through defensive structures and key terms such as LIBOR floors, which protect against decreases in the reference rate of a loan. While relatively lender-friendly when compared to bank-led transactions, we believe the benefits of Direct Lending are enhanced when a manager holds all or the majority of a transaction, facilitating a more prominent voice at the negotiating table.
We believe success in the asset class requires scale, flexible capital and longstanding relationships with borrowers and financial sponsors, which allows a manager to identify, evaluate and execute on investment opportunities while maintaining a disciplined and highly selective approach. Reflecting a focus on selectivity, Ares’ closing rate on Direct Lending opportunities has on average been approximately 4% since inception in 2004, meaning that Ares turns down 96%+ of the deals that are sourced.
While Direct Lending and Bank Loans have key distinctions, their structures and markets share a host of similarities, some of which can be exploited by managers with scale and experience in both sectors.
Similarities Across Corporate Lending: Benefits for Investors
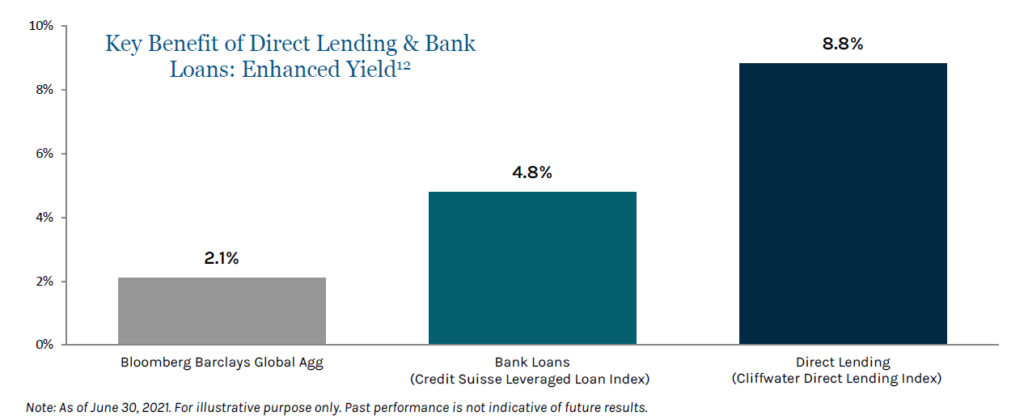
A number of similarities exist across the Direct Lending and Bank Loan asset classes which, we believe, can enhance an investor’s portfolio and lead to outperformance relative to traditional fixed income over time.
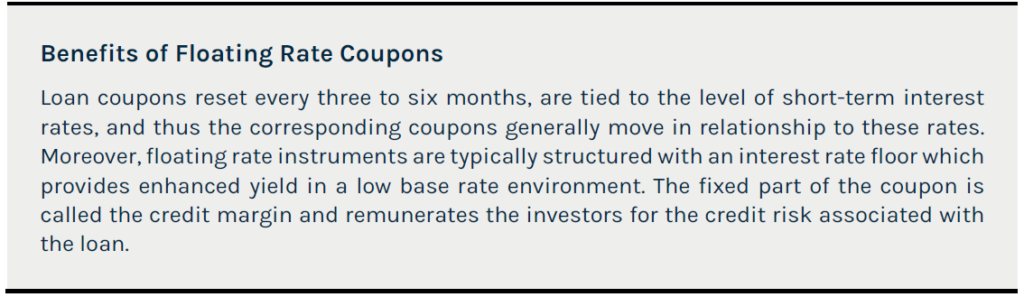
Structurally, both asset types typically pay a floating rate coupon that is linked to a reference rate such as LIBOR. This trait can provide benefits in a rising rate environment and protection against declines in the reference rate can be negotiated by managers, contributing to stable yields across market environments.
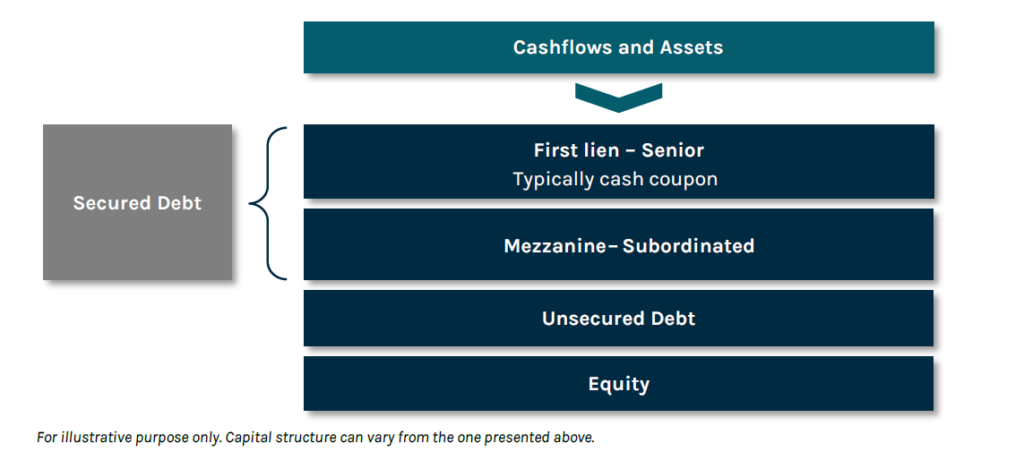
A key consideration for credit investing is seniority – in other words, where the loan ranks in the order of payments. Secured loans can be senior or deeply subordinated, meaning that they are either first or last in line in the right of payment. Since subordination reduces protection, subordinated loans generally pay a higher coupon than senior loans to compensate for the additional risk. These subordinated loans can be called “Mezzanine” assets. Direct Lending and Bank Loan assets typically come in these forms and sit ahead of unsecured debt, typically bonds, and equity holders in the capital structure, providing downside protection in a default scenario.
Conclusion
Some may view Direct Lending and Bank Loans as a singular asset class which finances private companies. While private companies are the typical borrowers in these transactions, we believe they should be viewed as distinct asset classes by investors due to their variances in sourcing, borrower size, liquidity, and yield. While distinct, these asset classes bear several similarities which can contribute to an investor’s portfolio, and can be optimized by a manager with scale and experience in both markets, such as Ares.
While the nature of investments may differ across Direct Lending and Bank Loans, at Ares, we apply the same rigorous, fundamental analysis across our credit platform. We believe there are common traits critical to successful credit investing, and in our experience, there are few managers who possess these strengths in both asset classes. Through cross platform collaboration, we believe our tenured history, global presence and scale in both markets allow us to better take advantage of synergies between the two markets which often results in enhanced deal flow, due diligence and preferred economics for our investors. For investors, this translates into opportunities for flexible, income-producing portfolios that can weather various market environments.
Teiki Benveniste is Head of Ares Australia Management
To read the full version, download the PDF
Endnotes
- Source: Ares as of September 2021. Assumptions are based on Ares current estimates and subject to change.
- Source: The World Bank: World Federation of Exchanges Database as of June 30, 2021. Includes U.S. listed domestic companies. Most recent data for number of public companies is as of 2019.
- Source: Wishire.com. In January 2000, the Wilshire 5000 index of 5,000 U.S. capitalization weighted equity securities contained 7,200 stocks with a total market capitalization of $13 trillion or an average company market cap of $1.8 billion. As of June 30, 2021, the Wilshire 5000 contained 3,500 stocks with a total market capitalization of $45 trillion or an average company market cap of $12.8 billion.
- Source: ICE BofA U.S. High Yield Constrained Index (HUC0), June 30, 2021.
- Preqin as of December 31. 2020. Private Equity AUM excludes venture capital, hybrid and fund of funds.
- Source: Preqin and World Bank. Private Equity (excluding venture capital, hybrid and fund of funds) Net Asset Value defined as AUM less dry powder. Global Public Equities Market Cap growth from 2000-2018 is from the World Bank Database, most recent complete global data. 2019 – 2020 increase is based on the growth in the Bloomberg World Exchange Market Capitalization Index.
- Includes invested capital from inception on October 8, 2004 through June 30, 2021. Includes investments made through Ares Capital Corporation, the Senior Secured Loan Program and the Senior Direct Lending Program. Excludes syndications within one year of origination, $1.8 billion of investments acquired from Allied Capital on April 1, 2010 and $2.5 billion of investments acquired from American Capital on January 3, 2017.
- Defined as realized gains/(losses) on assets with a payment default as a percentage of total invested capital since inception, divided by number of years since inception for all first lien and unitranche loans. This number includes interest, fees, principal proceeds, and related expenses.
- Represents the average annual broadly syndicated senior loan default rate of 2.8% per “Fitch U.S. Leveraged Loan Default Insights” for 2007-2020 multiplied by (1 minus the recovery rate for senior secured loans of 67%) per “Moody’s Annual Default Study” for 2007-2020. Data availability begins in 2007.
- Defined as realized gains/(losses) on assets with a payment default as a percentage of total invested capital since inception, divided by number of years since inception for all second lien and subordinated loans. This number includes interest, fees, principal proceeds, and related expenses.
- Represents Moody’s U.S. Trailing 12-Month Issuer-Weighted Spec-Grade Default Rate for 2007-2020 of 4.6% multiplied by (1 minus the recovery rate for subordinated unsecured debt of 37%) per “Moody’s Annual Default Study” for 2007-2020. Data availability begins in 2007.
- Sources: Barclays Global Aggregate Index, Credit Suisse Leveraged Loan Index, Cliffwater Direct Lending Index. Indices are unmanaged and have no fees. It is not possible to invest directly in an index.
Disclaimer
The views expressed in this article are those of the author(s) as of the date of the article. Ares has no obligation to provide updates on the subject in the future. The views are provided for informational purposes only, are not meant as investment advice, and are subject to change. Moreover, while this article expresses views as to certain credit investment opportunities, Ares may undertake investment activities on behalf of one or more investment mandates inconsistent with such views subject to the requirements and objectives of the particular mandate. Ares and its affiliates cannot guarantee the accuracy or completeness of any statements or data contained in this material.
These materials are neither an offer to sell, nor the solicitation of an offer to purchase, any security, the offer and/or sale of which can only be made by definitive offering documentation. Any offer or solicitation with respect to any securities that may be issued by any investment vehicle (each, an “Ares Fund”) managed or sponsored by Ares Management LLC or any of its subsidiary or other affiliated entities (collectively, “Ares Management”) will be made only by means of definitive offering memoranda, which will be provided to prospective investors and will contain material information that is not set forth herein, including risk factors relating to any such investment. Any such offering memoranda will supersede these materials and any other marketing materials (in whatever form) provided by Ares Management to prospective investors. In addition, these materials are not an offer to sell, or the solicitation of an offer to purchase securities of Ares Management Corporation (“Ares Corp”), the parent of Ares Management. An investment in Ares Corp is discrete from an investment in any fund directly or indirectly managed by Ares Corp. Collectively, Ares Corp, its affiliated entities, and all underlying subsidiary entities shall be referred to as “Ares” unless specifically noted otherwise.
The securities/investment process mentioned in this article may not be suitable for all investors. This article does not provide tailored investment advice and has been primarily for distribution to institutional investors and market professionals. In making a decision to invest in any securities of an Ares Fund, prospective investors should rely only on the offering memorandum for such securities and not on these materials, which contain preliminary information that is subject to change and that is not intended to be complete or to constitute all the information necessary to adequately evaluate the consequences of investing in such securities. Ares makes no representation or warranty (express or implied) with respect to the information contained herein (including, without limitation, information obtained from third parties) and expressly disclaims any and all liability based on or relating to the information contained in, or errors or omissions from, these materials; or based on or relating to the recipient’s use (or the use by any of its affiliates or representatives) of these materials; or any other written or oral communications transmitted to the recipient or any of its affiliates or representatives in the course of its evaluation of Ares or any of its business activities. Ares undertakes no duty or obligation to update or revise the information contained in these materials.
The recipient should conduct its own investigations and analyses of Ares and the relevant Ares Fund and the information set forth in these materials. Nothing in these materials should be construed as a recommendation to invest in any securities that may be issued by Ares Corp or an Ares Fund or as legal, accounting or tax advice. Before making a decision to invest in any Ares Fund, a prospective investor should carefully review information respecting Ares and such Ares Fund and consult with its own legal, accounting, tax and other advisors in order to independently assess the merits of such an investment.
These materials are not intended for distribution to, or use by, any person or entity in any jurisdiction or country where such distribution or use would be contrary to law or regulation.
Please see PDF to reference the full Disclaimer


