The “Sweet Spot” of Credit
Ares Australia Management
Executive Summary
Even before the COVID-19 pandemic rocked global financial markets, Australia was on its way to join the lower yield world. Now, Australian investors in search of stable, current income strategies are facing a challenge as strategies of the past are unlikely to generate the returns and levels of income they once provided.
This can be observed across the risk spectrum with the Reserve Bank of Australia’s (the “RBA”) cash rate at 0.10% and a large part of Australian government bond yields below 1%, all the way up the risk spectrum to Australian banks’ equity and their now more uncertain dividends.
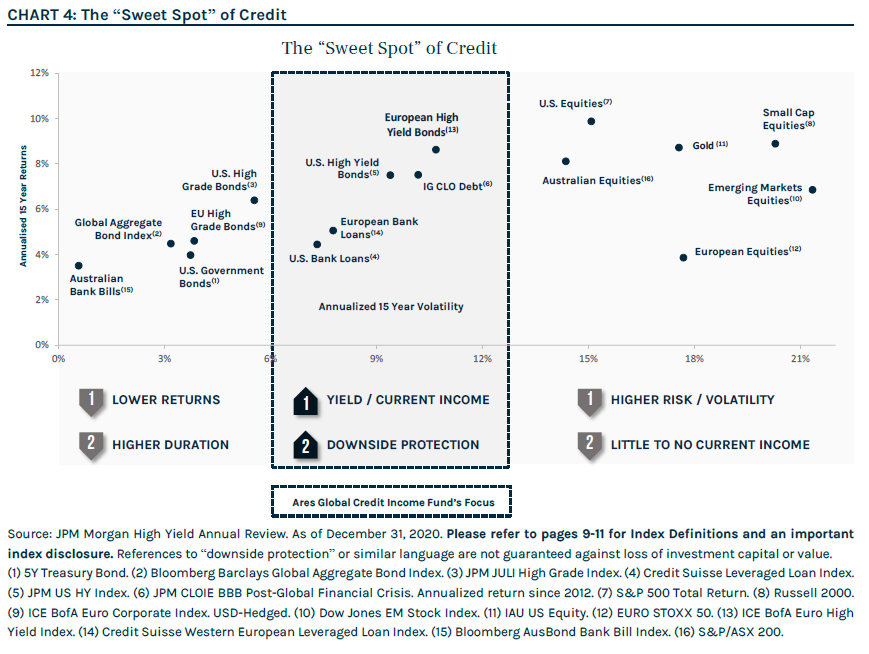
We believe solutions to generate higher income and diversification for Australian investors’ portfolios exist within certain parts of the global fixed income markets that provide current income and attractive relative yields with downside protection1 and limited exposure to interest rate duration; we call it the “sweet spot” of credit.
To be successful in what we call the “sweet spot,” we believe an arduous focus on capital preservation through fundamental credit selection and the flexibility to capitalise on the most attractive relative value are key. We believe this can be achieved via our ability to identify attractive relative value opportunities in the more senior, higher quality segments of the loan, bond and structured credit markets and shift allocations among these asset classes as appropriate. In addition to maintaining a well-diversified portfolio of senior debt, a 50% allocation to investment grade credit further strengthens the high-quality nature of the strategy.
The Challenge – Australia Joins the Low Yield World
Until recently, Australian investors didn’t have to look too far for attractive yields and income, but the last 24 months have accelerated Australia’s participation in the low cash rate and bond yield world.
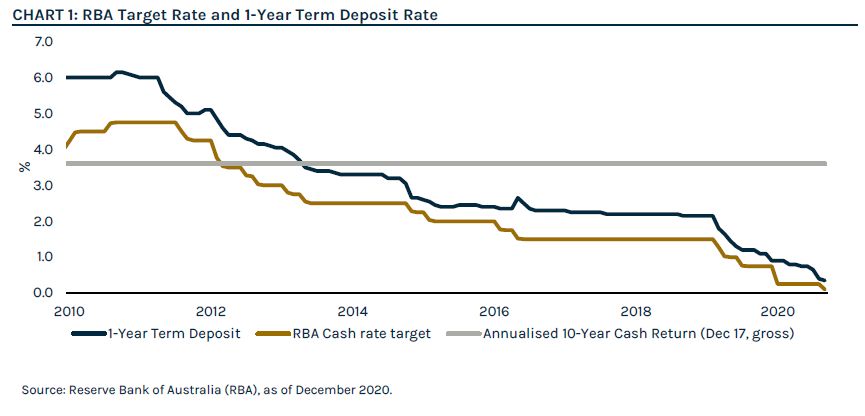
According to a report published by the ASX in 2018,2 in the last 20 years through December 2017, Australian cash annualised gross return was 4.6% p.a. Interestingly, cash returned 3.6% p.a. in the last 10 years through December 2017, which suggests a downward trajectory of the RBA target cash rate and term deposit rates (Chart 1).
With the target RBA cash rate currently sitting at 0.10%, achieving the returns of the past in cash products seems unlikely for Australian investors.
Moving up the risk spectrum (with risk defined as asset price volatility) in the last 10 years, Australian government and corporate bonds have offered attractive yields, generating higher income and returns than cash, with the same ASX report showing returns of c. 6% p.a. for the 10 years to December 2017.
These attractive returns and levels of income have partly been due to a falling yield environment which generates capital gains in fixed rate bonds. When realised, these gains are distributed as income alongside interest payments.
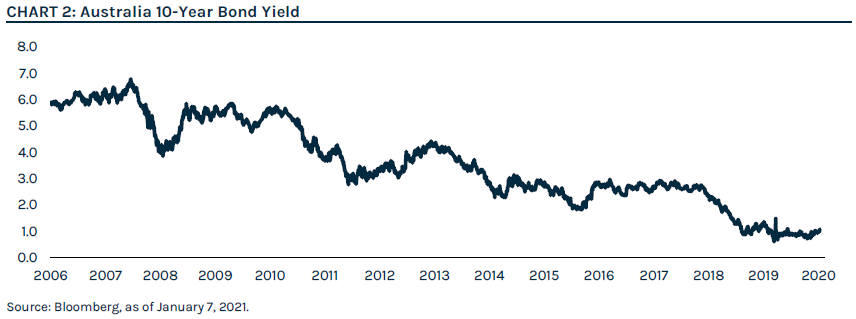
As illustrated in Chart 2 below, over the last 10 years through March 2020, Australian 10-year government bond yields went from over 5% to around 1% at the start of 2021, and in the last 12 months, from over 1.5% in March 2019 to an all-time low of 0.57% in March 2020. This latest drop has driven strong returns and provided the expected counterbalance to riskier assets such as equity in periods of volatility.
However, looking ahead, with 84% of Australia government bonds currently trading at or above 100% of face value and little room for yields to move further down (although they could go negative!), we believe income generation and outsized returns are unlikely while the risk of rising yields and capital losses cannot be ignored.
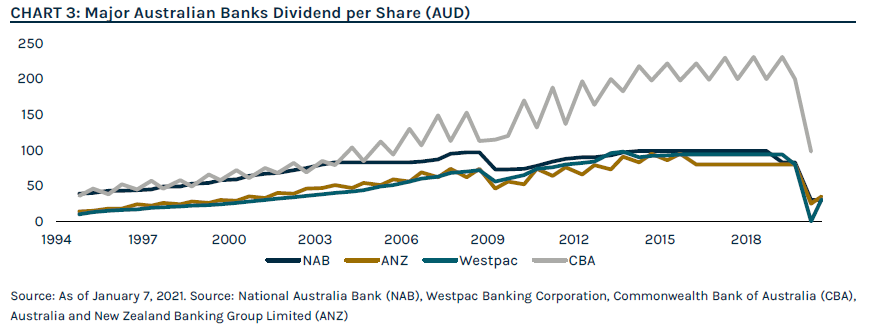
Finally, moving all the way up the risk spectrum to equities, Australian investors have enjoyed many years of high and dependable dividend payments from the major Australian banks. For those happy to endure some price volatility going up the risk spectrum, the four major Australian banks have been a reliable source of higher income.
However, in the wake of the COVID-19 crisis and the ensuing economic turmoil, an unprecedented level of uncertainty leaves many questioning the likelihood and reliability of those dividends as the banks employ a more conservative approach to cash management. As an example, in 2020 NAB decided to cut their dividend payment by 64%. NAB has not seen such low dividends since 1994. A common observation can be made across the four major Australian banks – even during the Global Financial Crisis (the “GFC”), dividends did not decrease as precipitously as they have recently (Chart 3). This has highlighted to investors that unlike fixed income and credit instruments, shares have no contractual obligation to a fixed level of distribution.
The “Sweet Spot” of Credit
The challenge posed by low yields is not new for many global investors. Since its founding in 1997, the Ares Credit Group has been able to diversify portfolios with asset classes that we believe offer attractive yields and current income within global fixed income markets. We call it the “sweet spot” of credit.
We believe high quality corporate and structured credit presents the most compelling risk-reward opportunity. Our strategy seeks to avoid riskier asset classes (equities) as well as minimise exposure to the more stressed, low quality segments of the credit market (CCC-rated bonds and loans). We believe this approach reduces volatility and default risk and further takes advantage of the downside protection offered by senior and often secured credit position in the capital structure of corporate bonds and loans and asset backed securities. In tandem, Ares believes this particular focus offers greater opportunities for current income in yield than traditional fixed income and passive strategies.
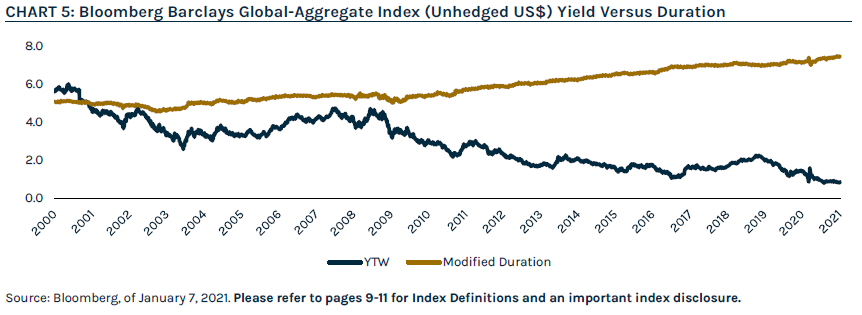
Within global fixed income specifically, sovereign yields remain low in the wake of the pandemic, resulting in past performance favouring higher interest rate duration assets (Chart 5). For example, U.S. government bonds and high-grade corporate bonds that have higher interest rate duration risk than bank loans or investment grade CLO debt have outperformed (higher return and lower volatility). But, with government bond yields at or close to historical lows, the potential return and current income generation from the lower end of the risk spectrum seems challenged.
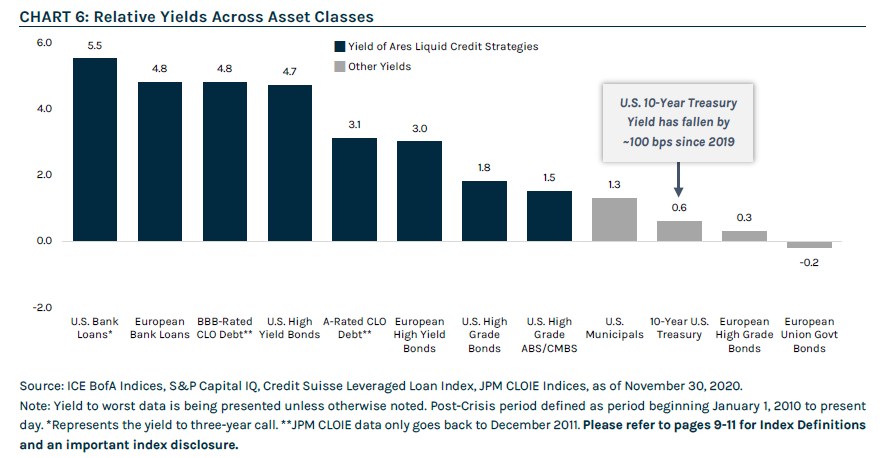
Our focus is therefore on the asset classes that currently offer higher relative yields. These higher yields are largely derived from the credit spreads these securities pay on top of government bond yields. These spreads compensate investors for the additional risk that they take by investing in credit. Even as markets recover from the March 2020 dislocation, we believe further spread compression amid a volatile and uncertain economic backdrop presents ample opportunity for managers looking to take advantage of inefficiently priced segments of the fixed income markets.
And, while dynamic allocation across asset classes is certainly a distinctive feature of Ares’ strategy, we recognise that falling yields is a global trend across developed and emerging markets and seek to opportunistically allocate across regions.
In other words, current income and potential returns are attractive in the sweet spot of credit, but to fully optimise the strategy, we believe managers must be focused on minimising default risk and capturing relative value opportunities.
Protecting the Downside3
As a credit investor, avoiding defaults and capital losses is part of the Ares DNA.
Default risk analysis is fully incorporated into Ares’ investment process, which employs rigorous monitoring of credit performance with the robust use of data analytics to identify potential downgrade candidates. This focus has resulted in Ares experiencing significantly lower defaults in its broadly syndicated bank loan and high yield bond strategies since inception, including during times of stress. At the height of the GFC fall-out in 2009, U.S. high yield bond and loan markets saw default rates rise close to 11% and 15%,4 respectively, while Ares’ flagship bank loan fund and U.S. High Yield composite5 have experienced fewer than 4%. Ares’ European portfolios performed similarly, with its flagship European high yield portfolios experiencing a 3.4% default rate during the GFC versus the market’s 13%. During the same period, Ares’ flagship European loans portfolios experienced 0 defaults.6
Independent of the fund’s 50% allocation to investment grade credit, Ares is intently focused on maintaining a high-quality portfolio. Given the strength of today’s market, we have positioned the portfolio to be moderately “risk-on” and believe there is considerable value to be uncovered in the Single-B portion of the market. However, disciplined credit selection remains key to constructing a balanced portfolio that is both downside protected7 and poised to capture the upside. In current market conditions, we believe our ability to significantly under-default the market will again prove critical to capitalising on opportunities available in the sweet spot of credit.
Finally, a heightened focus on portfolio positioning, volatility and duration are of particular importance during times of stress and economic uncertainty to manage downside risk. As an example, the Fund’s exposure to interest rate risk measured by effective duration is currently around 1.6 years with 70% of the Fund invested in floating rate instruments. Interestingly, a large portion of these floating rate instruments have embedded income protection against lower or negative rates through LIBOR floors. This means that out of the 1.6 years of interest rate duration, 50% of the Fund’s duration risk is an asymmetric exposure that will benefit the Fund if rates fall and not impact returns if interest rates rise.
Capturing Relative Value Opportunities
Our investment process places a strong emphasis on relative value analyses to identify optimal risk-adjusted investment opportunities, and we believe relative value will be of critical importance as credit spreads continue to tighten across our target asset classes. Furthermore, today’s favourable technical backdrop, discussed in greater detail below, presents a compelling argument for casting a wide net in the fixed income universe.
In loans, CLOs are the dominant buyer and holder of loans, and Street forecasts predict an increase in gross CLO issuance in 2021 which should help to offset a pick-up in leveraged loan issuance brought about by any uptick in LBO-related deals. A tightening of CLO AAA spreads to 90-110 bps could accelerate the pace of CLO issuance and cause loan spreads to compress further. At the same time, retail investors, which at one point represented 20% of the US loan market, have fallen to a mere 5%8 and could be an incremental driver of demand should rising rate concerns return in a strengthening economic environment. The European leveraged loan market continues to be wholly owned by institutional investors, which should promote a stable pathway of moderate spread tightening over the next 12 months.
Within the bond market, we expect the pace of U.S. new issuance to cool from 2020’s torrid tempo but remain elevated from a historical perspective as companies seek to lock in low yields. European high yield bond supply is likely to increase in 2021, which can be attributed to the large cohort of BB-rated issuers with ongoing financing needs, many of which entered the asset class this year as fallen angels. We believe supply in both markets will be met by strong demand from both institutional and retail investors seeking relatively attractive valuations, in an environment where traditional investment-grade fixed income portfolios trade with historically low yields and meaningful interest rate duration.
Alternative credit continues to provide multiple ways to find value and protection in different market conditions. CLO Debt in particular has consistently provided a premium to corporate yields across rating classes, ranging from 2.6% for single-A tranches to 7.0% for double-B rated tranches.9 We believe the asset class is currently providing attractive yields but we remain patient and continue to favor transactions with high quality underlying portfolios and ample time remaining in their reinvestment periods. Given our cautious stance despite the current market strength, we continue to be conservative in our underwriting of potential investments and will not stretch on credits.
Regardless of the market environment, the Ares approach to investing with full transparency to the underlying assets allows for the ability to sift through a variety of available investment opportunities to find the assets that best provide the combination of current income with loss protection, which we can combine with loans and bonds to build a portfolio that meets our investors’ needs.
Conclusion
We believe the “sweet spot of credit,” comprised of corporate and structured markets, offers a compelling opportunity for Australian investors seeking diversification and stable current income in varied market environments. To be successful in the so-called “sweet spot,” we believe a rigorous focus on capital preservation and the flexibility to select the most attractive relative value opportunities are key. We believe a nimble and flexible style of portfolio management with the ability to dynamically allocate across asset classes when shifts in relative value occur is paramount. Further, we believe the ability to identify and unlock value, especially in currently volatile and bifurcated markets, is a key strength of Ares. Finally, with capital preservation as a core characteristic of the strategy, managers should be intently focused on finding those opportunities with optimal downside protection and lower volatility.
1 References to “downside protection” or similar language are not guaranteed against loss of investment capital or value.
2 “2018 Russell Investments/ASX Long Term Investing Report” June 2018, https://www.asx.com.au/documents/research/russell-asx-long-term-investing-report-2018.pdf
3 References to “downside protection” or similar language are not guaranteed against loss of investment capital or value.
4 J.P. Morgan Default Monitor, as of June 1, 2020.
5 Performance for High Yield Bonds is represented by the U.S. High Yield Composite, which includes all actual, fully discretionary, fee-paying, separately managed portfolios that primarily invest in U.S. high yield fixed income securities.
6 Past performance is not indicative of future results.
7 References to “downside protection” or similar language are not guaranteed against loss of investment capital or value.
8 JP Morgan, as of December 15, 2020.
9 Source: J.P. Morgan CLOIE, as of December 31, 2020.
This article contains the opinions of the Alternative Credit Team and is neither an offer to sell, nor the solicitation of an offer to purchase, any security, the offer and/or sale of which can only be made by definitive offering docs. The opinions expressed herein are subject to change without notice. Information contained herein has been obtained from sources believed to be reliable but is not guaranteed. All charts, graphs and tables are shown for illustrative purposes only. This article is distributed for educational purposes and should not be considered investment advice or an offer of any security for sale. Past performance is not indicative of future results and no representation is made that stated results will be replicated.
Index Definitions
The Bloomberg Barclays Capital Global Aggregate Bond Index (“Global Bond Agg”) measures the performance of global investment grade debt from twenty-four local currency markets. This multi-currency benchmark includes treasury, government-related, corporate and securitized fixed-rate bonds from both developed and emerging market issuers. To be included in the index, bonds must be investment grade using the index credit quality classification methodology (middle rating of Moody’s, Fitch and S&P). The currency must be freely tradeable and convertible and not exposed to exchange controls that are designed to encumber its buying and selling by foreign investors. There must be an established and developed forward market or non-deliverable forward (NDF) market for the local currency such that foreign market participants can hedge their exposures into core currencies. Inception date: January 1, 1990.
JPMorgan US Liquid Index (“U.S. High Grade Bonds”) measures the performance of the investment grade dollar denominated corporate bond market. The JULI focuses on the most liquid instruments with the objective of making the index a fair and true representation of the investable market. To be included, instruments must be liquid, USD denominated investment grade corporate debt and a bullet security paying a non-zero coupon semi-annually. Excludes convertibles, refundables, extendables and perpetuals. Aggregate level total return is calculated as a market-weighted average of individual bond level returns. Previous day weights are used to aggregate current day returns. Performance and statistics are available by individual issuers, for sectors and sub-sectors, and maturity buckets (dating back to 31-Dec-1999).
Credit Suisse Leveraged Loan Index (“U.S. Bank Loans”) is designed to mirror the investable universe of the $US-denominated leveraged loan market. The index inception is January 1992. The index frequency is daily, weekly and monthly. New loans are added to the index on their effective date if they qualify according to the following criteria: 1) Loan facilities must be rated “5B” or lower. That is, the highest Moody’s/S&P ratings are Baa1/BB+ or Ba1/BBB+. If unrated, the initial spread level must be Libor plus 125 basis points or higher. 2) Only fully-funded term loan facilities are included. 3) The tenor must be at least one year. 4) Issuers must be domiciled in developed countries; issuers from developing countries are excluded.
JPMorgan Domestic High Yield Index (“U.S. High Yield Bonds”) is designed to mirror the investable universe of the U.S. dollar domestic high yield corporate debt market.
JP Morgan U.S. CLO Index (“IG CLO Debt”) tracks floating-rate CLO securities in 2004-present vintages. Additional sub-indices are divided by ratings AAA through BB, and further divided between pre- and post-crisis vintages. CLO 2.0, or post-crisis vintages, include deals issued in 2010 and later. CLOIE utilizes a market-value weighted methodology. Inception date: July 15, 2014.
Standard & Poor’s 500 (“U.S. Equities”), often abbreviated as the S&P 500, or just “the S&P”, is an American stock market index based on the market capitalizations of 500 large companies having common stock listed on the NYSE or NASDAQ. The S&P 500 index components and their weightings are determined by S&P Dow Jones Indices.
Russell 2000 (“Small Cap Equities”) is an index measuring the performance of approximately 2,000 smallest-cap American companies in the Russell 3000 Index, which is made up of 3,000 of the largest U.S. stocks. It is a market-cap weighted index.
The ICE BofA Euro Corporate Index USD-Hedged (“European High Grade Bonds”) tracks the performance of EUR denominated investment grade corporate debt publicly issued in the eurobond or Euro member domestic markets. Qualifying securities must have an investment grade rating (based on an average of Moody’s, S&P and Fitch) and at least 18 months to final maturity at the time of issuance. In addition, qualifying securities must have at least one year remaining term to final maturity, a fixed coupon schedule and a minimum amount outstanding of EUR 250 million. Original issue zero coupon securities and pay-in-kind securities, including toggle notes, qualify for inclusion in the Index. Callable perpetual securities qualify provided they are at least one year from the first call date. Fixed-to-floating rate securities also qualify provided they are callable within the fixed rate period and are at least one year from the last call prior to the date the bond transitions from a fixed to a floating rate security. Contingent capital securities (“cocos”) are excluded, but capital securities where conversion can be mandated by a regulatory authority, but which have no specified trigger, are included. Other hybrid capital securities, such as those issues that potentially convert into preference shares, those with both cumulative and non-cumulative coupon deferral provisions, and those with alternative coupon satisfaction mechanisms, are also included in the index. Euro legacy currency, equity-linked and securities in legal default are excluded from the Index. Securities issued or marketed primarily to retail investors do not qualify for inclusion in the index.
Dow Jones Emerging Markets Index (“Emerging Markets Equities”) is designed to measure 95% of the market capitalization coverage of stocks traded in emerging markets. Included in the Dow Jones Global Indices family are a wide range of regional, country, size-segment, and sector indices. The indices are float-adjusted market capitalization (FMC) weighted, with caps applied to certain indices within the family to ensure diversification among companies within those indices.
iShares Gold Trust (“Gold”) seeks to reflect generally the performance of the price of gold.
EURO STOXX 50 (“European Equities”) is a market capitalization-weighted stock index of 50 large, blue-chip European companies operating within Eurozone nations. Components are selected from the Euro STOXX Index, which includes large-, mid- and small-cap stocks in the Eurozone.
The ICE BofA European Currency High Yield Constrained Index (“European High Yield Bonds”) tracks the performance of EUR and GBP denominated below investment grade corporate debt publicly issued in the eurobond, sterling domestic or euro domestic markets. Qualifying securities must have a below investment grade rating (based on an average of Moody’s, S&P and Fitch), at least 18 months to final maturity at the time of issuance, at least one year remaining term to final maturity as of the rebalancing date, a fixed coupon schedule and a minimum amount outstanding of EUR 250 million or GBP 100 million. Original issue zero coupon bonds and pay-in-kind securities, including toggle notes, qualify for inclusion in the Index. Callable perpetual securities qualify provided they are at least one year from the first call date. Fixed-to-floating rate securities also qualify provided they are callable within the fixed rate period and are at least one year from the last call prior to the date the bond transitions from a fixed to a floating rate security. Contingent capital securities (“cocos”) are excluded, but capital securities where conversion can be mandated by a regulatory authority, but which have no specified trigger, are included. Other hybrid capital securities, such as those issues that potentially convert into preference shares, those with both cumulative and non-cumulative coupon deferral provisions, and those with alternative coupon satisfaction mechanisms, are also included in the index. Equity-linked securities, securities in legal default and hybrid securitized corporates are excluded from the index.
Credit Suisse Western European Leveraged Loan Index (“European Bank Loans”) is designed to mirror the investable universe of the leveraged loan market of issues which are denominated in US$ or Western European currencies. The issuer has assets located in or revenues derived from Western Europe, or the loan represents assets in Western Europe, such as a loan denominated in a Western European currency. Loan facilities must be rated “5B” or lower. That is, the highest Moody’s/S&P ratings are Baa1/BB+ or Ba1/BBB+. Only fully funded term loan facilities are included and the tenor must be at least one year. Minimum outstanding balance is $100 million and new loans must be priced by a third-party vendor at month-end. The index inception is January 1998.
Bloomberg AusBond Bank Bill Index (“Australian Bank Bills”) is engineered to measure the Australian money market by representing a passively managed short term money market portfolio. This index is comprised of 13 synthetic instruments defined by rates interpolated from the RBA 24-hour cash rate, 1M BBSW, and 3M BBSW.
S&P/ASX 200 (“Australian Equities”) is recognized as the institutional investable benchmark in Australia. Index constituents are drawn from eligible companies listed on the Australian Securities Exchange. The S&P/ASX 200 is designed to measure the performance of the 200 largest index-eligible stocks listed on the ASX by float-adjusted market capitalization. Representative, liquid, and tradable, it is widely considered Australia’s preeminent benchmark index.
Note: This may contain information sourced from Bank of America, used with permission. Bank of America’s Global Research division’s fixed income index platform is licensing the ICE BofA Indices and related data “as is,” makes no warranties regarding same, does not guarantee the suitability, quality, accuracy, timeliness, and/or completeness of the ICE BofA Indices or any data included in, related to, or derived therefrom, assumes no liability in connection with their use and does not sponsor, endorse, or recommend Ares Management, or any of its products or services.
DISCLAIMER
The information in this publication is current as at the date of publication and is provided solely by Ares Management LLC (Ares). Ares is exempt from the requirement to hold an Australian Financial Services Licence. Ares is subject to regulation by the Securities & Exchange Commission of the United States of America under US laws, which differ from Australian laws. None of Ares Australia Management Pty Limited, Fidante Partners Limited, nor any of their associates, has prepared the information in this publication and accept no liability whatsoever in relation to it.
This publication is only made available to ‘wholesale clients’ or ‘sophisticated investors’ under the Corporations Act 2001 (Cth) in Australia.
This publication has been prepared without taking into account any person’s objectives, financial situation or needs. Any person receiving the information in this publication should consider the appropriateness of the information, in light of their own objectives, financial situation or needs before acting on the advice. Persons receiving this information should obtain and read any disclosure document relating to any financial product to which the information relates before making any decision about whether to acquire that product.
No reliance: This publication is provided to you on the basis that it should not be relied upon for any purpose other than information and discussion. The publication has not been independently verified. None of Ares, Fidante Partners Limited, Ares Australia Management Pty Ltd, nor any of their respective related bodies corporates, associates and employees, make any republications, warranty or undertaking (express or implied) and accepts no responsibility for the adequacy, accuracy, completeness or reasonableness of the publication or as to the performance of any product. The information contained in the publication does not purport to be complete and is subject to change. No reliance may be placed for any purpose on the publication or its accuracy, fairness, correctness or completeness. None of Ares, Fidante Partners Limited, Ares Australia Management Pty Ltd, nor any of their respective related bodies corporates, associates and employees shall have any liability whatsoever (in negligence or otherwise) for any loss howsoever arising from any use of the publication or otherwise in connection with the publication. Any forward-looking statements in this publication: are made as of the date of such statements; are not guarantees of future performance; and are subject to numerous assumptions, risks and uncertainties because they relate to events and depend on circumstances that may or may not occur in the future. Ares undertakes no obligation to update such statements. Past performance is not a reliable indicator of future performance.
Confidentiality and intellectual property: This publication is confidential and may not be copied, reproduced or redistributed, directly or indirectly, in whole or in part, to any other person in any manner.
Risk: no person guarantees the performance of, or rate of return from, any product or strategy relating to this publication, nor the repayment of capital in relation to an investment in such product or strategy. An investment in any such product or strategy is not a deposit with, nor another liability of, Ares, Fidante Partners Limited, Ares Australia Management Pty Ltd nor any of their respective related bodies corporates, associates or employees. Investment in any product or strategy relating to this publication is subject to investment risks, including possible delays in repayment and loss of income and capital invested.
REF: AAM-00082


